Case study
MLGuard
Applied AI/ML Engineering
MLGuard is a network intrusion detection prototype that classifies live traffic. I built it with Scapy to capture packets into bidirectional flows with 68 features, scikit-learn scaling and 50-component PCA, an XGBoost classifier for attack, normal, and scanning traffic, and Flask with Socket.IO streaming results to a React dashboard with CSV export.
How it’s built
MLGuard · Network intrusion detection prototype with live flow classification and a monitoring dashboard
MLGuard is a network intrusion detection prototype for analysts who want to watch local traffic as it is classified. I built a Scapy capture worker that batches 50 packets, groups them into bidirectional TCP and UDP flows and computes the 68 CICIDS-style features the model expects. Saved scaler and 50-component PCA transforms feed an XGBoost classifier with three classes, and a Flask and Socket.IO backend streams results to a five-page React dashboard with filtered CSV export.
- flow features per bidirectional flow
- 68
- PCA components (68 features reduced to 50)
- 50
- traffic classes (attack, normal, scanning)
- 3
- XGBoost trees (max_depth 6, multi:softprob)
- 100
- Flask HTTP routes
- 10
- React dashboard pages
- 5
Technology and what it does here
- Scapy
- Sniffs packets on a selectable interface and parses IP, TCP and UDP layers
- pandas / NumPy
- Compute per-flow size, inter-arrival time and TCP flag statistics
- scikit-learn
- Saved StandardScaler, PCA (50 components) and LabelEncoder applied at inference
- XGBoost
- Classifies each flow as attack, normal or scanning
- Flask
- REST API for paginated history, per-minute stats, CSV upload and filtered download
- Flask-SocketIO
- Pushes each classified packet record to the dashboard as a 'packet' event
- React 19 + TypeScript
- Dashboard, analysis, upload, download and interface settings pages
- Recharts
- Traffic timeline and predicted class distribution charts
- socket.io-client
- Receives live packet events and connection state in the browser
- Tailwind CSS 4 + Vite
- Dashboard styling and frontend build
Implementation details
- Flows are keyed on (src, dst, sport, dport, proto) and reverse packets are matched to the original key so forward and backward statistics are split correctly.
- Capture and inference are decoupled: a Scapy sniff thread enqueues packets and a worker thread processes them in batches of 50 before emitting over Socket.IO.
- The interface can be changed at runtime through PUT /api/config, which lists interfaces with Scapy get_if_list and restarts the sniffer.
- History endpoints filter saved predictions by source, destination, protocol, prediction and time range, and /api/stats resamples counts per minute and returns top-100 sources and destinations.
System architecture
MlGuard converts captured packets into bidirectional flow features. The inference service uses the same preprocessing as training and passes classifications to the dashboard.
Project screenshots
 Open full-size screenshot in a new tab
 Open full-size screenshot in a new tab
 Open full-size screenshot in a new tab
Results and testing
Source and dashboard evidence
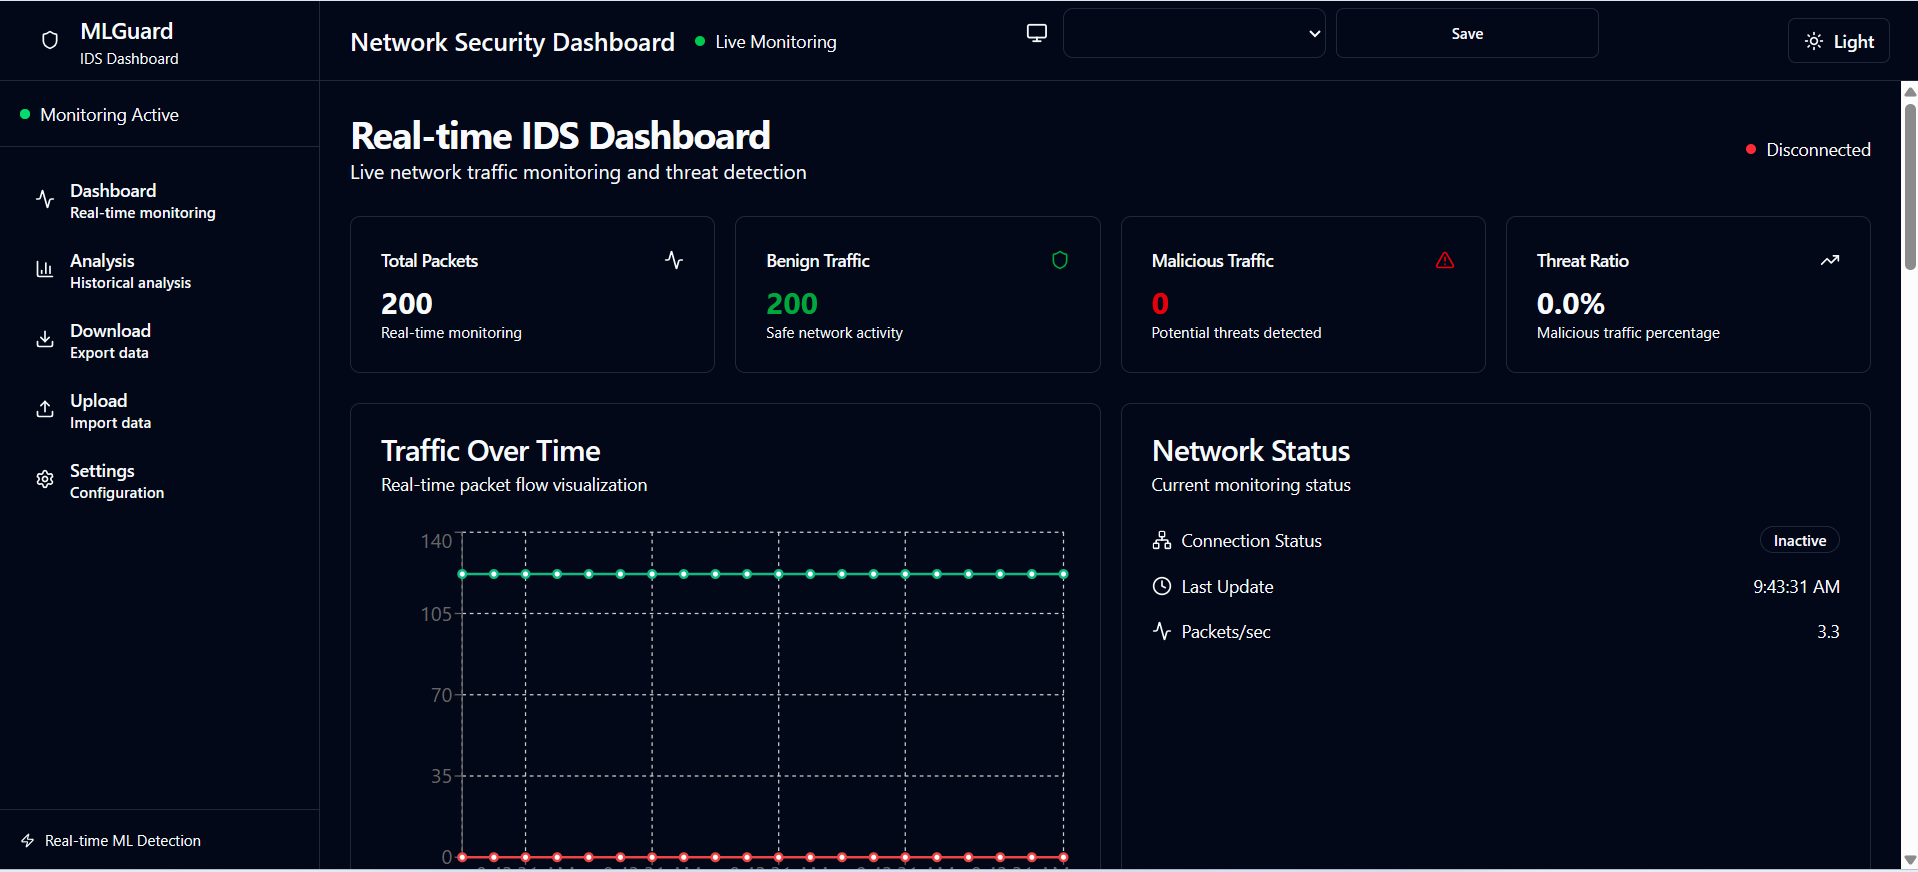
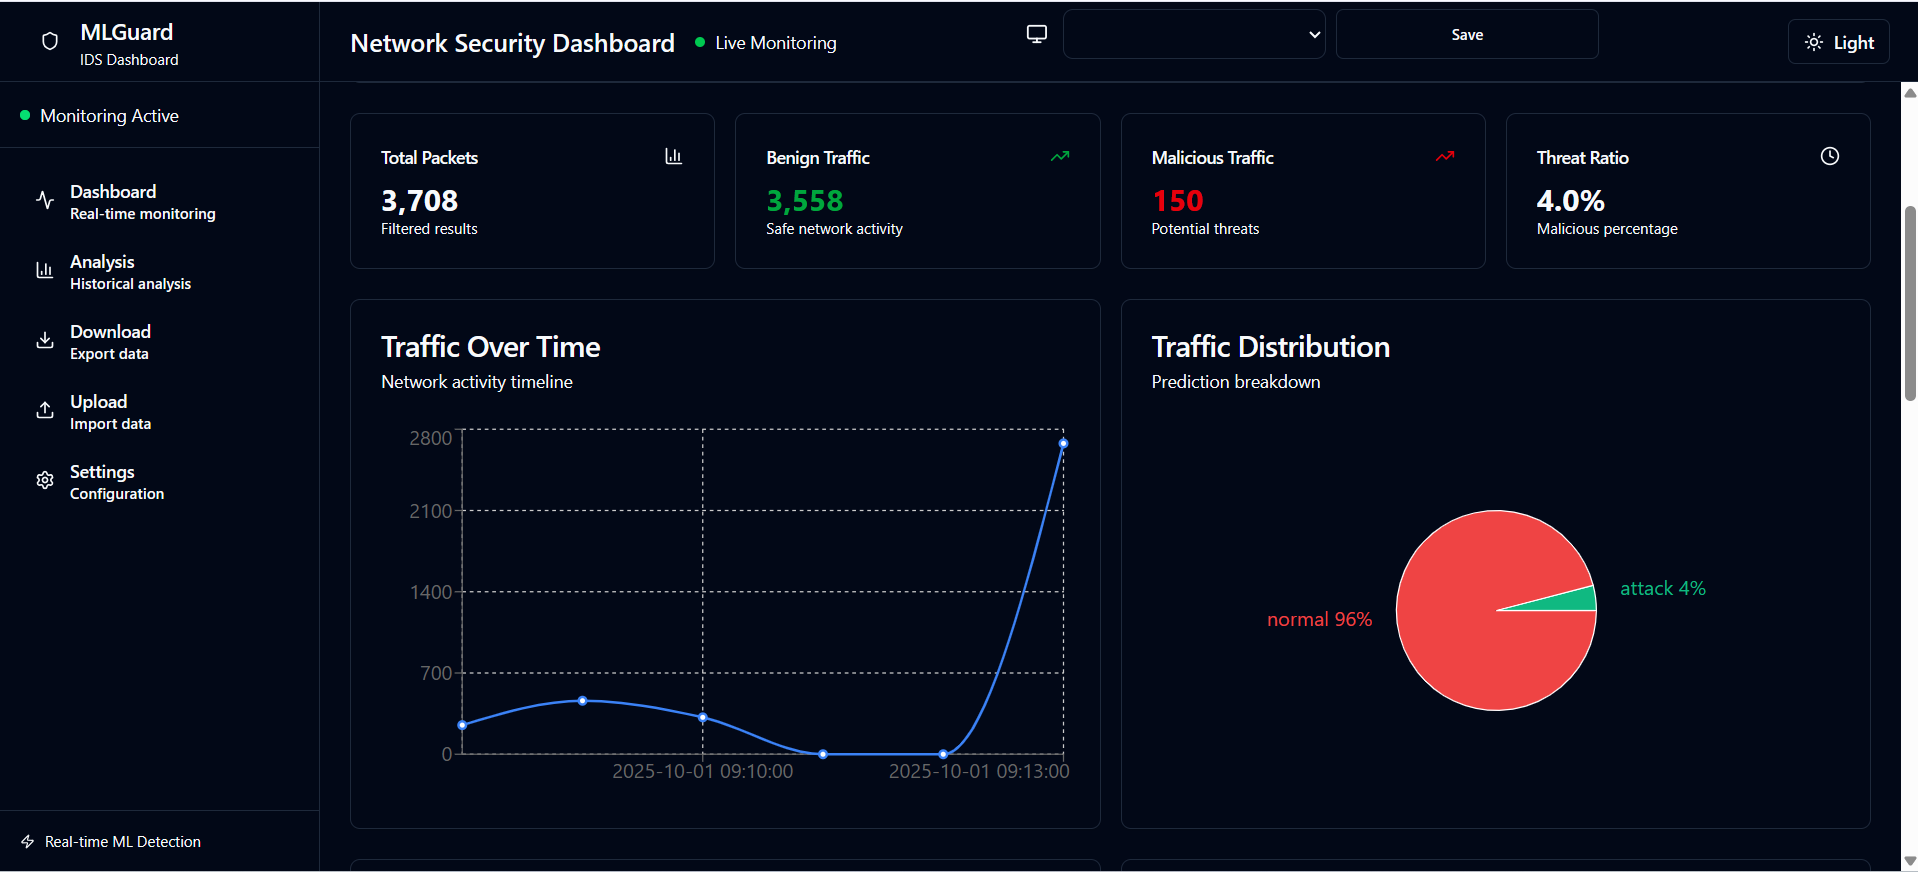
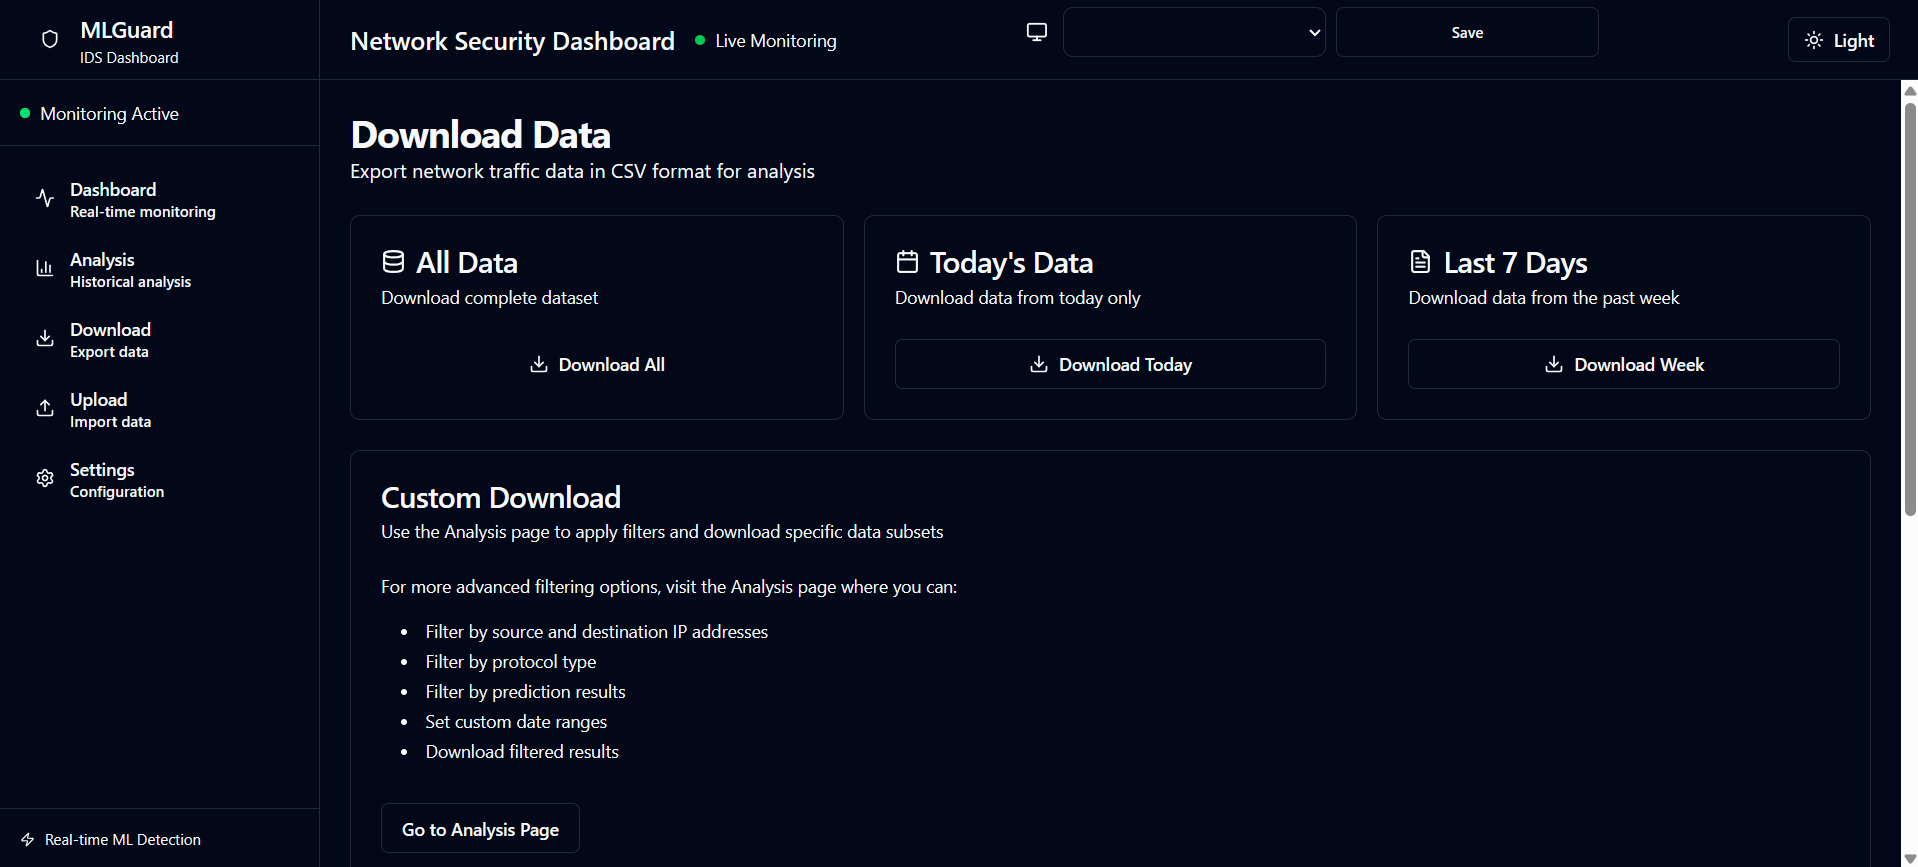
The source traces traffic from Scapy capture to feature extraction, XGBoost inference, and the monitoring APIs. The screenshots show the live dashboard, historical analysis, and export controls.
First engineering priority
Keep predictions associated with their original flow when emitting packet records. The prototype currently applies the last flow prediction in a batch to each packet row. A fixture with two differently classified flows would verify the fix before reporting detection quality.
From Packet Capture to Flow Classification
A network packet contains only part of the behavior the model needs. I built a flow feature extractor to bridge live traffic capture and the classifier’s tabular inputs.
Build bidirectional flow features
I grouped TCP and UDP packets by source, destination, ports, and protocol, then associated reverse traffic with the original flow. The feature extractor computes directional packet counts, timing, sizes, and TCP flag statistics.
Carry model preprocessing into inference
I ordered the feature columns against the configured input list, reused the saved scaler and PCA transforms, and decoded XGBoost predictions to traffic labels.
Live Monitoring and Historical Review
The application gives an analyst a way to inspect predictions while traffic arrives and return to saved records after capture.
Connect the capture process to the dashboard
I separated packet capture from background inference with a queue and sent the resulting packet records to the dashboard over Socket.IO. The interface shows connection state alongside the traffic timeline.
Add filters and exports
I added Flask endpoints for paginated history, traffic counts over time, and CSV export. An analyst can filter saved records by endpoints, protocol, prediction, and time range.
Technologies
- Python
- Scapy
- pandas
- scikit-learn
- XGBoost
- Flask
- Socket.IO
- React
- TypeScript